
The growth of music streaming services and how they deliver music to the consumer is changing the way we mix and master content, especially for music streaming services. In this article and free video tutorial in conjunction with Nugen Audio, our own loudness guru Mike Thornton shows how the loudness wars have destroyed the dynamic range of our music and how loudness normalisation used my music streaming services is enabling us to bring back life into our music tracks.
What Went Wrong With The Loudness Wars
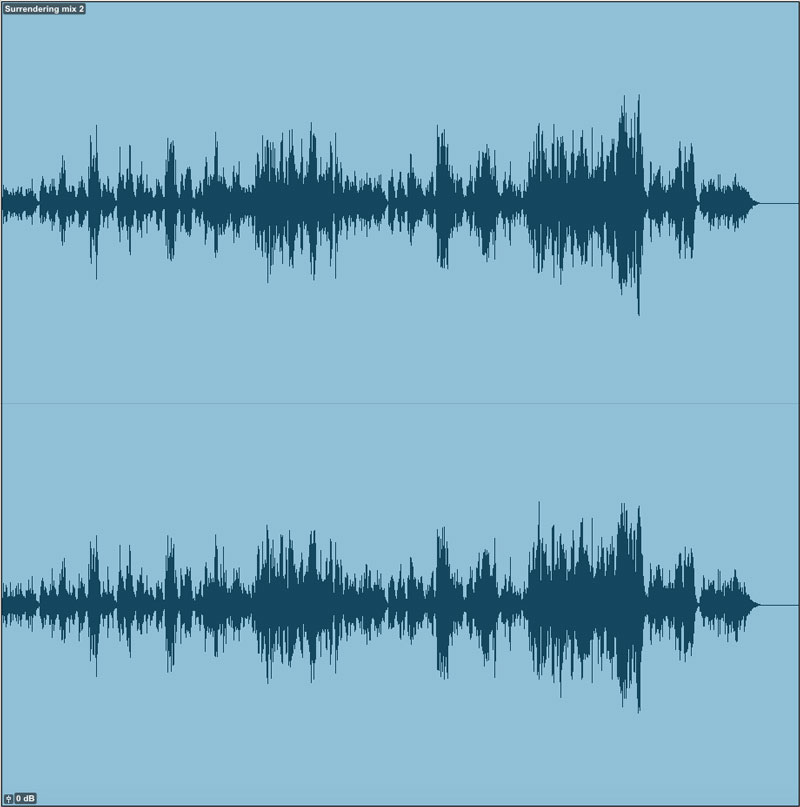
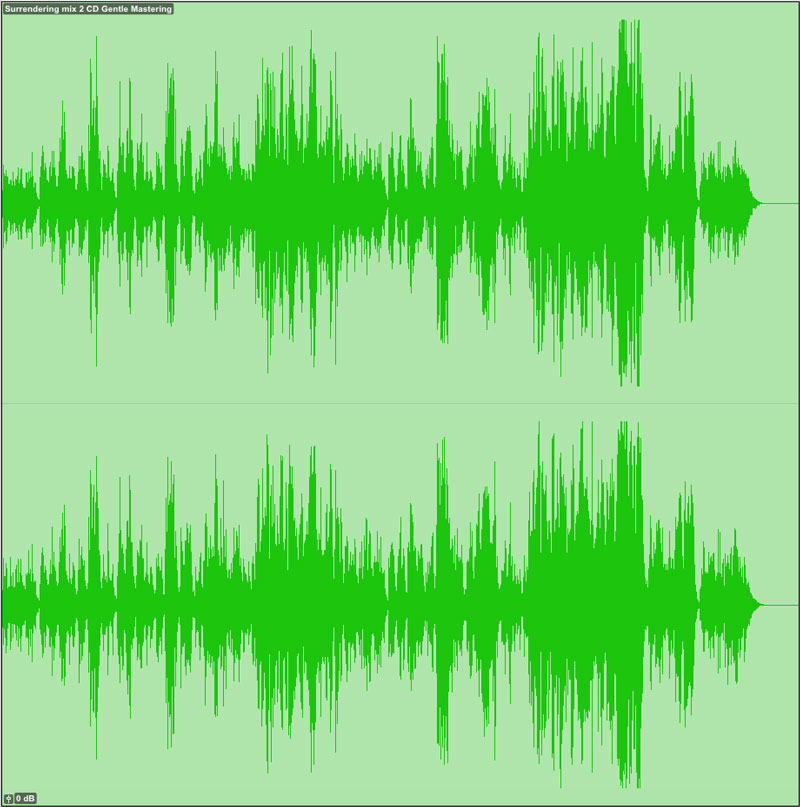
Using compression techniques to try and make ‘my CD louder than your CD’ have meant that we have tended to lose dynamic range in our mixes and masters. Normally when a track that has been mixed and is ready for mastering the peaks won't go all the way up to 0dB, there is some headroom to play with as in the blue waveform above.
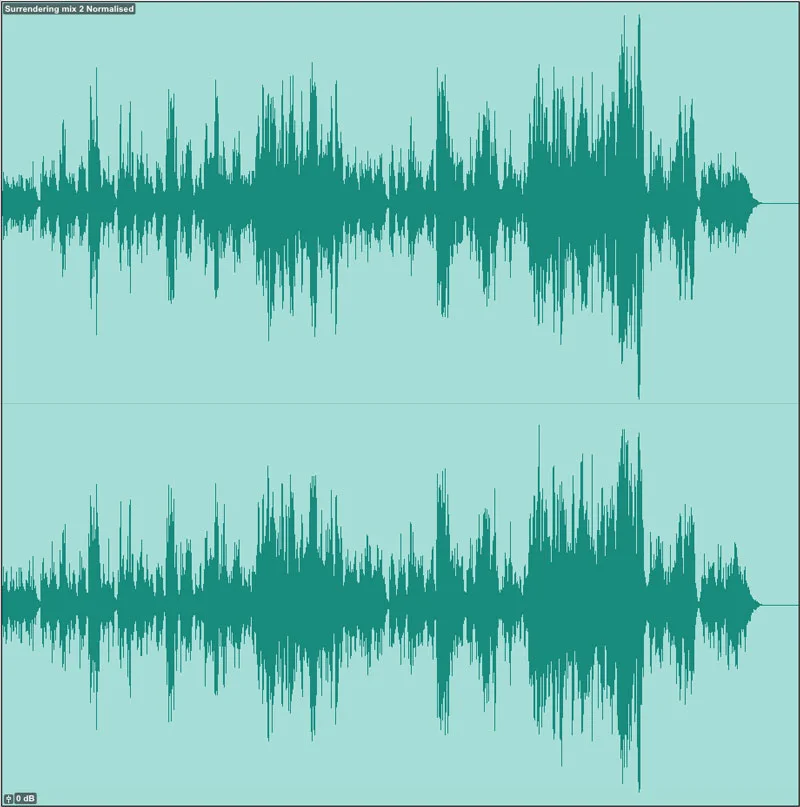
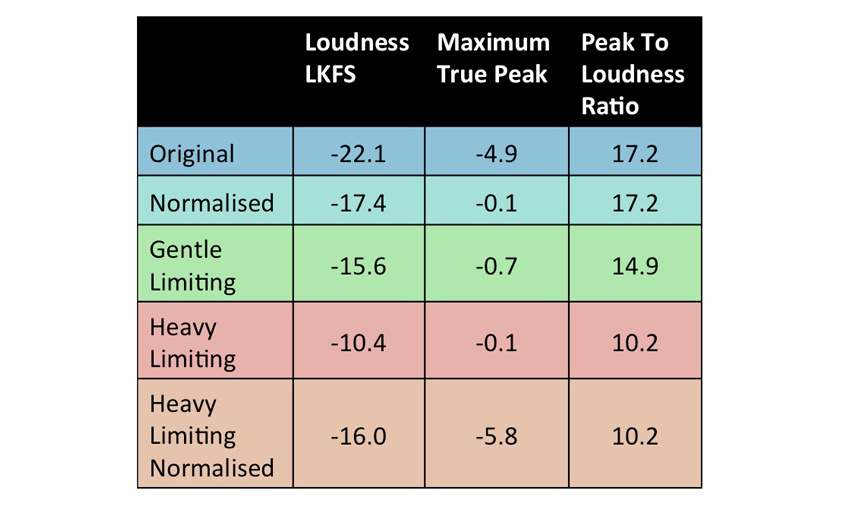
The first technique in mastering was to normalise it so the highest peak would be just under digital headroom, this is the turquoise waveform above. It's a simple gain change to bring the overall level of the track up so that the loudest point doesn’t quite hit digital headroom, and in the example above this gain change increases the perceived loudness by 4.5 Loudness Units with 1LU equivalent to 1dB. This is how the early CDs were mastered, but with the start of the ‘loudness wars’ this wasn’t considered to be enough.
At first subtle compression techniques were employed to gently increase the perceived volume without increasing the peak level. With subtle peak limiting we can make the lower level content louder but we have to compress the audio so that the peaks don’t get any higher. This is the green waveform above. This subtle limiting increases the loudness by a further 2LU.
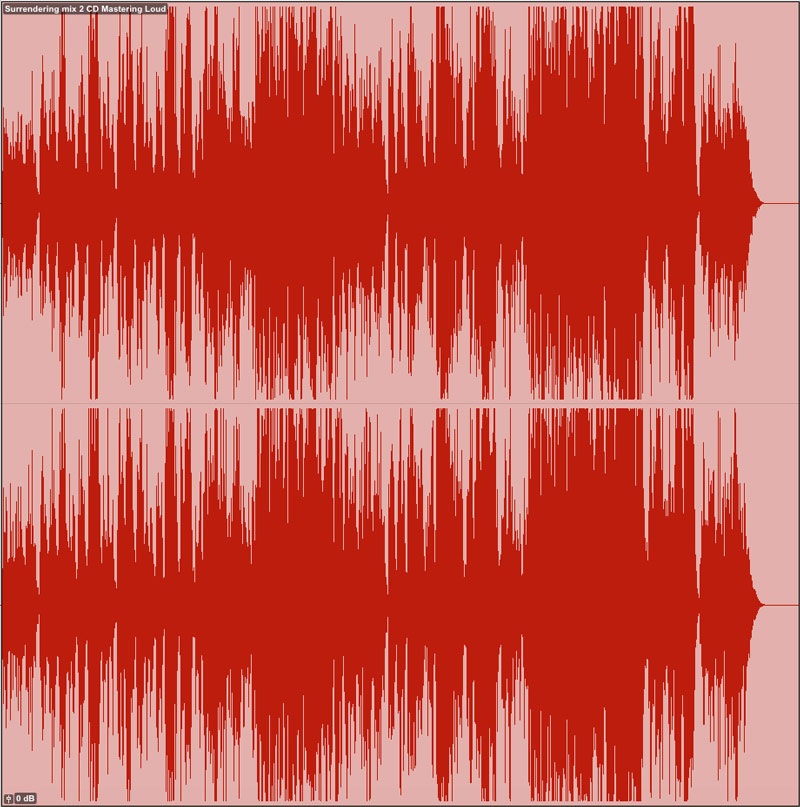
As the loudness wars increased, so did the amount of compression and the dynamic range continued to drop as the life was squashed out of the music. In the next example with the red waveform, we have a very heavily compressed version of the same track and you can see how the quieter parts are so much louder and this version is another 5LU louder than the gently processed version.
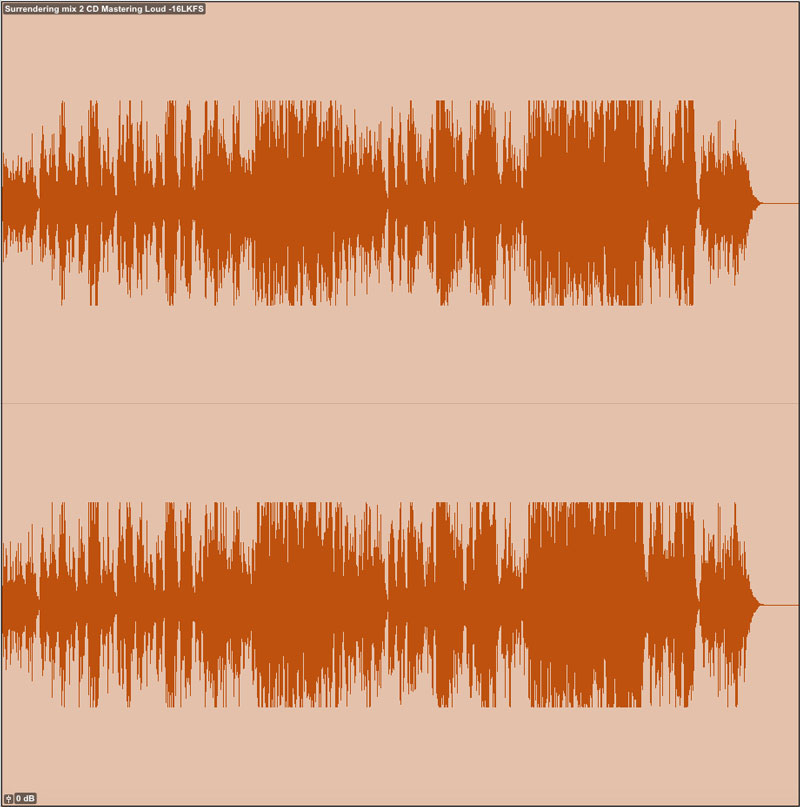
What happens when music streaming services use loudness normalisation to match all the tracks is that the heavily compressed version just gets turned down, so you end up with a quieter heavily compressed track as shown by the example with the orange waveform and what is the point in that? You end up with wasted headroom that could have used fully like the green gently mastered version.
What Loudness Do I Work To?
The table below shows the different loudness normalisation levels and codecs for some of today’s most popular streaming platforms. With this information, it’s possible to tailor your mix or master to each specific platform, but as a general rule of thumb, keeping the audio below -13 LUFS is a multipurpose method for a general cross-platform master.
| Platform | Loudness target | Codec |
|---|---|---|
| Spotify | -14 LUFS | Ogg Vorbis |
| YouTube | -13 LUFS | AAC-LC / Opus |
| Apple Music | -16 LUFS | AAC-LC |
| Tidal | -14 LUFS | AAC-LC |
| AES Recommended Practice | -20 to -16 LUFS | N/A |
Micro Dynamics And Macro Dynamics
As you can see from the table above, with recent updates to playout loudness levels, the main platforms now only differ by 3 LU between the loudest and the softest. Clearly there is no benefit in mixing louder than the loudest platform (at which point all platforms will be turning down your audio).
But how should we consider dynamics? A song can be dynamic in various different ways, but in terms of loudness it might be useful to consider “micro” dynamics and “macro” dynamics. This article discusses the former.
Micro Dynamics
Micro dynamics are the defined at the sample level - very rapid changes in level that provide detail, punch and clarity to a sound, often referred to as transients. In music production it is common to use compressors and limiters to control the transients, evening them out, reducing peaks, and raising the overall loudness of a track. But when major streaming services use loudness normalisation, it doesn’t make sense to over-compress, because your track will not be any louder once it reaches the listener. A good indicator of micro dynamics is the Peak to Loudness Ratio (PLR). The smaller the PLR the more sausage-like the audio waveform looks like.
The more dynamics there are on a micro level, the higher the peaks will be when your track is normalised for streaming. In order to take advantage of this, you could try to avoid over-compressing your drum bus, or ease off your mastering limiter a little to let the transients come through. You can literally view micro dynamics in action by zooming into the waveform of your mixdown and examining how clearly you can see the pulse of the track.

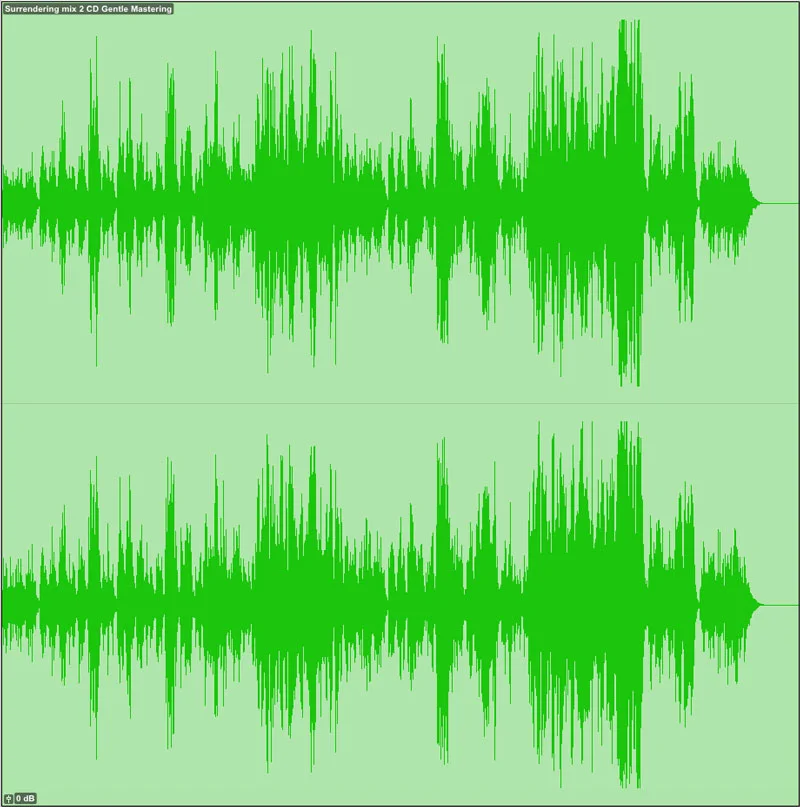
The image above shows two versions of the same track, both normalised to the same integrated loudness. The first version is heavily compressed, the second version isn't.
Of course, this is an artistic decision rather than an imperative, but a piece of music which is dynamic on a micro scale might appear to “pop” more when played alongside other loudness normalised tracks. The overall loudness will be more or less the same, but the maximum peak level can work out significantly higher.
This can often be seen at play when modern remasters of classic albums are added to Spotify. If a track has been heavily compressed for a modern CD remaster, narrowing the dynamics on a micro scale, then less of the headroom is utilised. Once normalised for streaming, there is no perceived loudness gained, only dynamics lost. For example, take a look at this table outlining the differences for one particular track as an example, the original 1983 master of ZZ Top’s ‘Sharp Dressed Man’
| Sharp Dressed Man | CD | Spotify |
|---|---|---|
| Original (1983) | -10.6 LUFS / +0.2 dBTP | -14.0 LUFS / -3.2 dBTP |
| Remaster (2008) | -7.9 LUFS / +0.6 dBTP | -14.0 LUFS / -5.5 dBTP |
For the streaming listener, neither master is louder than the other overall, but the remaster has a far narrower dynamic range and uses 2.3 dB less of the available headroom. Clearly both versions were produced before streaming became a major concern for mastering engineers, but the implications are clear.
Macro Dynamics
As well as considering the dynamics of your track on a “micro” scale, it can also be useful to view this on a “macro” scale. Essentially, macro dynamics refers to the relative loudness between different sections of a track, rather than the individual transients.
It is perfectly possible to have a piece of music with an integrated loudness of -14 LUFS but with some sections (a particularly climactic chorus, for example) which average significantly louder, as long as there are quieter sections to balance this out. Streaming services do not generally include significant dynamics processing within loudness normalisation, therefore as long as your track meets the loudness target overall and the True Peaks don’t clip, individual sections can be as loud as you like. Loudness Range (LRA) gives us a good measure of macro-dynamics.
What Tools Can I Use?

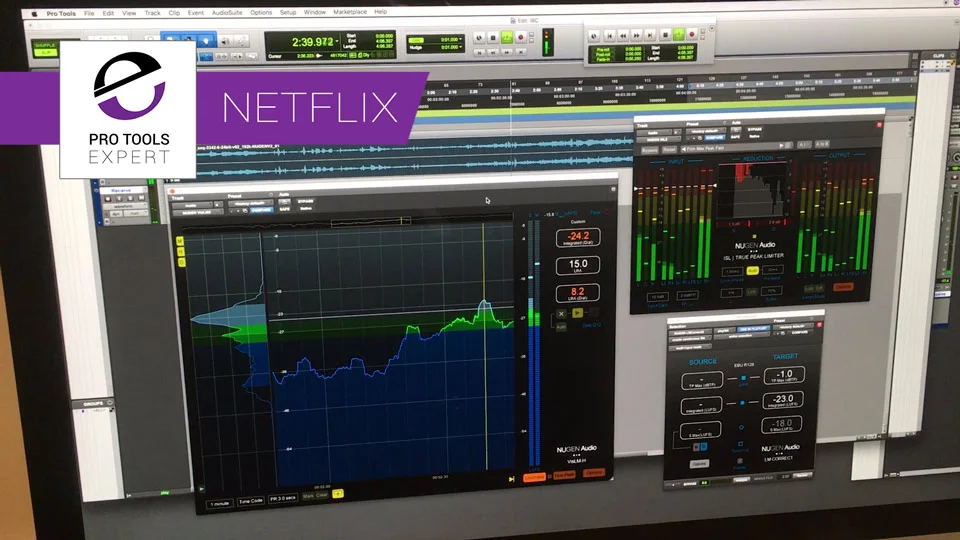
Plug-ins like MasterCheck allow you to regain control by auditioning these streaming codecs, and measuring the True Peak output after the encoding process. You can monitor this in real-time, both visually and audibly, ensuring your work is preserved all the way to the listener and avoiding nasty surprises later on. Monitoring several codecs simultaneously from within your DAW allows you to make informed choices for optimal playback across all streaming platforms.
How MasterCheck from Nugen Audio Can Help
The plug-in is divided into two sections the numeric displays at the top and the meters at the bottom.
Loudness Meter
Firstly a loudness meter, which measures Loudness using a worldwide standard, that has been developed to produce a meter that responses like our ears to loudness.
Peak To Loudness Ratio
Next we have a meter which displays the Peak to Loudness ratio and in effect this displays the amount of dynamic range or how much audio compression there is on a track and notice how the colour changes from green for good, through amber for OK to red warning that you are probably overdoing the processing. The meter displays the short-term peak to loudness whereas the numeric display up here displays the peak to loudness ratio using the average loudness since the last reset.
True Peaks Are Important
Finally, in the meter section, there is a true peak meter to make sure you are not going over digital headroom and we will be looking at this in more detail in the 3rd video in this series..
What's Next?
In the last article and free video tutorial in this series we are going to demonstrate the importance of True Peak metering and limiting and how they can help prevent the consumer getting distorted tracks.